Sectional Times in Greyhound Racing Explained
Best Greyhound Betting Sites – Bet on Greyhounds in 2026
Loading...
Beyond the Clock: What Sectionals Reveal
Overall time tells you who won. Sectional time tells you why. That distinction is the core reason why serious greyhound analysts treat sectional data as a higher grade of information than simple finishing times — and why punters who learn to use it gain an edge that most of the market ignores.
A greyhound’s overall race time is the number that appears in results and on the form card. It measures the total elapsed time from the moment the lids open to the moment the dog crosses the finish line. It is useful, but it is also blunt. Two dogs can post an identical finishing time of 29.50 seconds and have run completely different races — one leading throughout at a controlled pace, the other coming from behind with a ferocious closing burst. The raw time treats those two performances as equal. They are not.
Sectional times break the race into segments, typically timed at each bend or at specific distance markers. Instead of one number, you get three or four, each revealing a different phase of the race. The first sectional tells you about the dog’s early pace and trap break. The middle sectional tells you about sustained speed. The final sectional tells you about closing ability and stamina. Together, they paint a picture of how the dog distributed its effort — a picture that the overall time cannot provide alone.
For bettors, this granularity matters because it helps identify dogs whose raw form understates or overstates their true ability. A dog that posted a slow overall time might have been impeded early and closed the final section faster than anything else in the field — a sign of latent ability that the finishing position does not reflect. Conversely, a dog that won in a fast overall time might have been unchallenged on the lead, and its sectionals may show a pronounced slow-down in the final phase — a sign that it may not sustain that form against stronger competition.
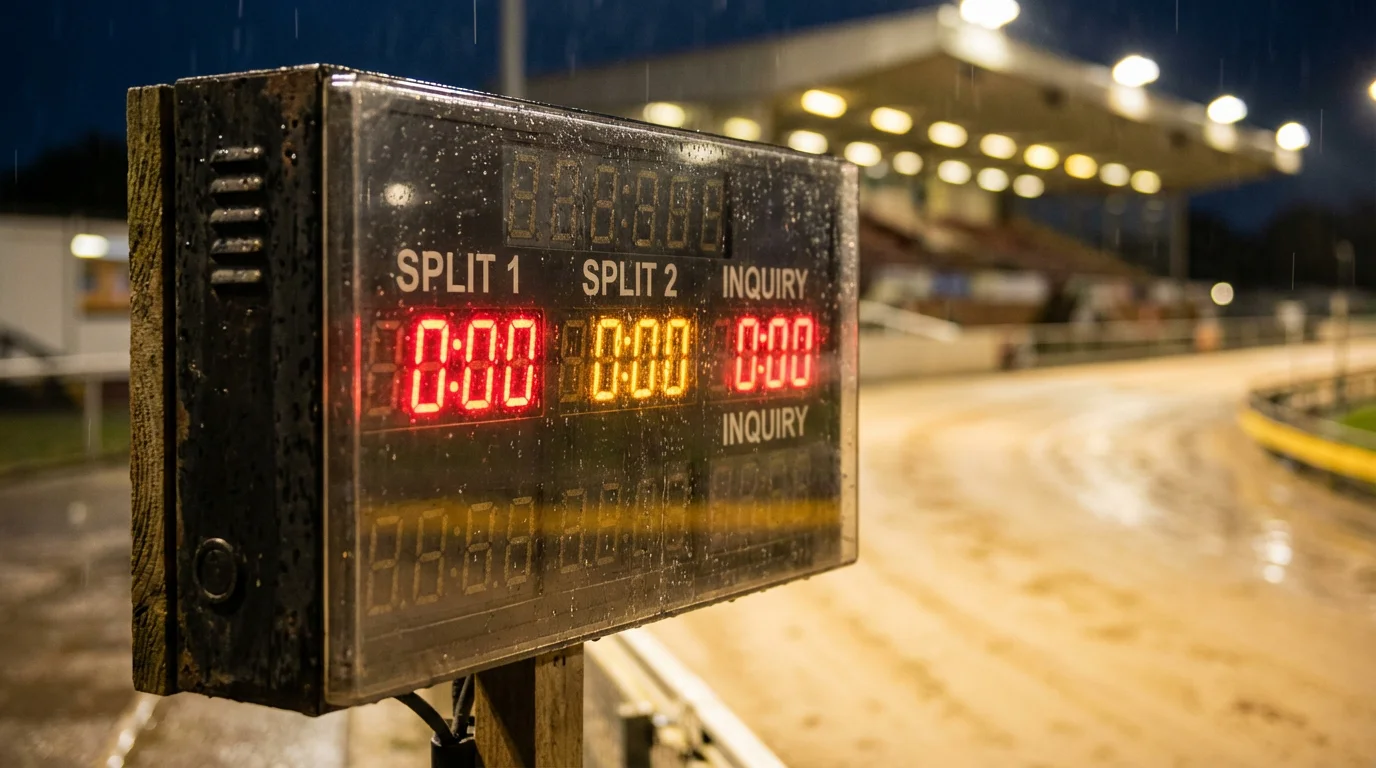
How Sectional Times Work
Splits at each bend, plus run-up time — that is the raw data. Understanding how it is collected and what each component represents is essential before you start drawing conclusions.
Most UK greyhound tracks use electronic timing systems that record the time at specific points around the circuit. The standard measurements are: the run-up time (from traps opening to the first timing beam, usually near the first bend), and subsequent splits for each section of the track between bends or distance markers. The exact number of splits varies by track — some record two intermediate times, others three — but the principle is consistent.
The run-up time measures the initial phase from trap rise to the first timing point. This is the purest measure of early pace. A dog with a consistently fast run-up time is a quick trapper — it breaks sharply and reaches the first bend in a leading or prominent position. A slow run-up time indicates a dog that is sluggish from the boxes, which correlates strongly with the closer running style discussed elsewhere. The run-up time is particularly valuable because it is less affected by race interference than later splits — at the start, the dogs have not yet converged and the timing reflects individual ability more cleanly.
The middle sections measure sustained pace through the body of the race. These splits are most affected by racing position and interference. A dog running on the lead will often record faster middle sections simply because it has a clear path, while a dog stuck in traffic may post slower splits not because it is slower but because it is unable to run freely. Reading middle-section times therefore requires context — you need to know where the dog was racing in the field, not just how fast it covered the ground.
The final section measures closing speed. This is the split from the last timing point to the finish line and is the most informative for assessing stamina and finishing ability. A dog that posts the fastest final section in the race is one that either maintained its pace better than the others or accelerated when they faded. Either way, it is a positive indicator — especially for races at longer distances where finishing ability becomes more important.
Not all tracks publish sectional data to the public. Timeform and some specialist greyhound data providers compile sectional information from tracks that make it available. If you are serious about using sectionals, check which of your regular tracks provide this data and integrate it into your form study. For tracks where sectionals are unavailable, you can still infer pace patterns from positional data on the racecard (where the dog sat at each bend), though this is a less precise substitute.
Using Sectionals to Compare Dogs
Two identical finishing times can hide completely different race patterns — and it is the pattern, not the time, that predicts future performance more reliably.
Consider two dogs that both ran 29.60 over 480 metres at the same track last week. Dog A’s sectionals were 3.80 (run-up), 10.20 (first section), 9.80 (middle), and 5.80 (final). Dog B’s were 4.10 (run-up), 10.50 (first section), 9.60 (middle), and 5.40 (final). The overall times are nearly identical, but the profiles are entirely different. Dog A was fast early and faded slightly. Dog B was slow early and finished with the fastest closing split. If these two meet in the same race, the outcome depends on the race dynamics — but the sectionals tell you that Dog B has more in reserve and may be the better bet if the pace is strong and the leader tires.
Sectional comparison also reveals effort level. A dog that led throughout and posted even sectionals across the race has run an efficient, controlled race. A dog that posted a very fast first section followed by progressively slower splits was under maximum effort early and fading — its overall time may be impressive, but the effort required to achieve it suggests it was close to its limit. If that dog is promoted to a higher grade and faces a genuine challenger for the early lead, the sectionals predict trouble.
The fastest sectional at each stage of the race is another useful metric. Across a meeting, you can check which dogs posted the best run-up time, the best middle split, and the best closing split. Dogs that rank highly on multiple sectional measures across different races are genuinely talented. Dogs that rank highly on one measure but poorly on others have a specific profile that suits specific race conditions — useful information when those conditions materialise.
When comparing sectionals across different meetings, adjust for track conditions. A slow evening after rain will produce slower sectionals across the board, so a dog’s absolute splits from that meeting should not be compared directly with splits from a fast night two weeks earlier. Compare relative performance — how a dog’s sectionals stacked up against the rest of the field on the same night — rather than absolute numbers.
Incorporating Sectionals Into Your Selection Process
Sectionals do not replace form — they sharpen it. The goal is not to build a selection method based exclusively on sectional data, but to add it as a layer on top of your existing process.
If you already use a points-based form system, sectional data can inform two of your scoring categories directly. Early pace can be scored using run-up times — a dog with a consistently fast run-up gets a higher early-pace score. Closing ability can be scored using final-section splits — a dog that regularly posts the fastest or second-fastest closing split in its races gets credit for strong finishing.
For punters who use a more intuitive approach, sectionals serve as a confirmation or correction tool. You have studied the form, watched replays, and formed a view on two or three dogs in a race. Before committing to a bet, check the sectional profiles. Do they confirm your view, or do they raise questions? A dog you fancy for its recent wins might reveal progressively slower closing splits — a sign that it is winning now but may be reaching its ceiling. A dog you were inclined to dismiss might show exceptional closing speed that was wasted in races where it was trapped behind slower dogs.
One practical tip: focus on sectional consistency rather than one-off peaks. A dog that posted a blazing run-up time once but is usually slow from the boxes had a fluke, not a pattern. A dog that consistently posts top-three closing splits across five or six races has a genuine profile that you can rely on. Patterns are signals. Outliers are noise.
The Race Inside the Race
Sectionals let you see the race the way the dog experienced it — not as a single outcome, but as a sequence of efforts and adjustments across 30 seconds of flat-out running.
Most punters experience a greyhound race as a blur. Six dogs, one finish line, a result. They see who won and who lost, but they do not see how the race unfolded in its component parts. Sectional data slows the race down. It reveals the phases — the explosive start, the jostling for position through the bends, the final effort to the line — and assigns a number to each one. Those numbers tell you more about a dog’s capability than the finishing position alone ever could.
The punter who invests time in understanding sectional times develops a qualitative advantage. They see value that the rest of the market misses, because most punters do not bother with sectionals at all. They identify improving dogs before the improvement shows up in finishing positions. They spot dogs that are masking fatigue behind winning results. They understand why a dog ran a certain time, not just that it did.
It takes effort to incorporate sectionals into your analysis. The data is not always easy to find, the calculations require attention, and the conclusions are not always clear-cut. But the punters who do the work are the ones who consistently find bets that the casual market overlooks — and in a sport where margins are thin and competition for value is fierce, that is exactly the kind of edge worth pursuing.